Concept of virtual beam (vbeam)
The concept of virtual beam (cf. vbeam) has been introduced in order to match as much as possible real physical part (cross beam or piece of seat track) and to make abstraction of Finite Elements. As the FTools software is automatically performing comparison between different FE models with different meshing, the usage of vbeam allows a common reference.
A virtual beam is associated with one unique property ID and it is linked to several Finite Elements.
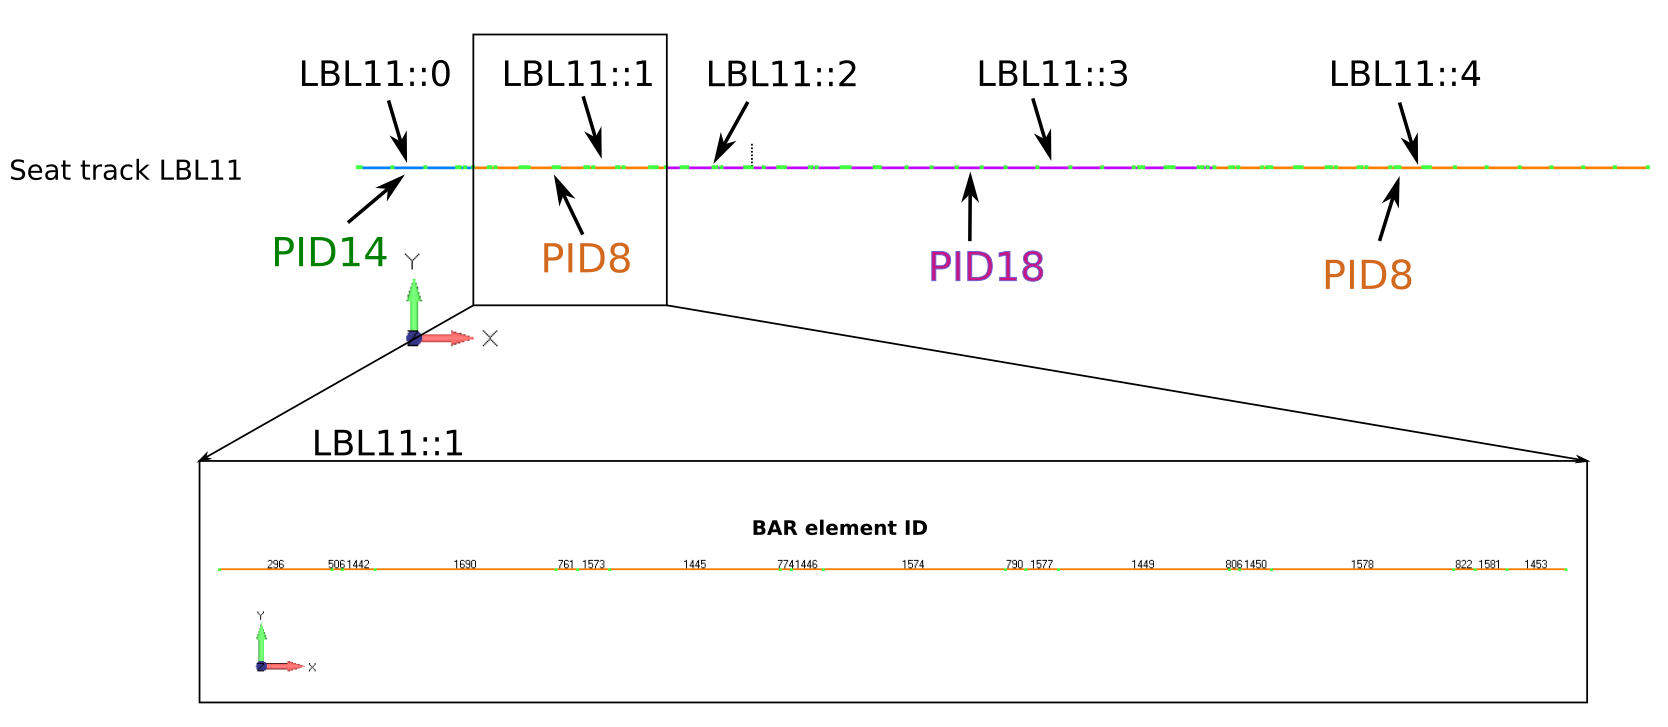
Fig. 9 View of vbeams on seat track LBL11
The checked model and the Reference model are based on the same floor structure but with different loading (different interface load applied at different locations on seat tracks). As show on Fig. 10 the number of BAR elements and their ID are different on both model due to different load application nodes.
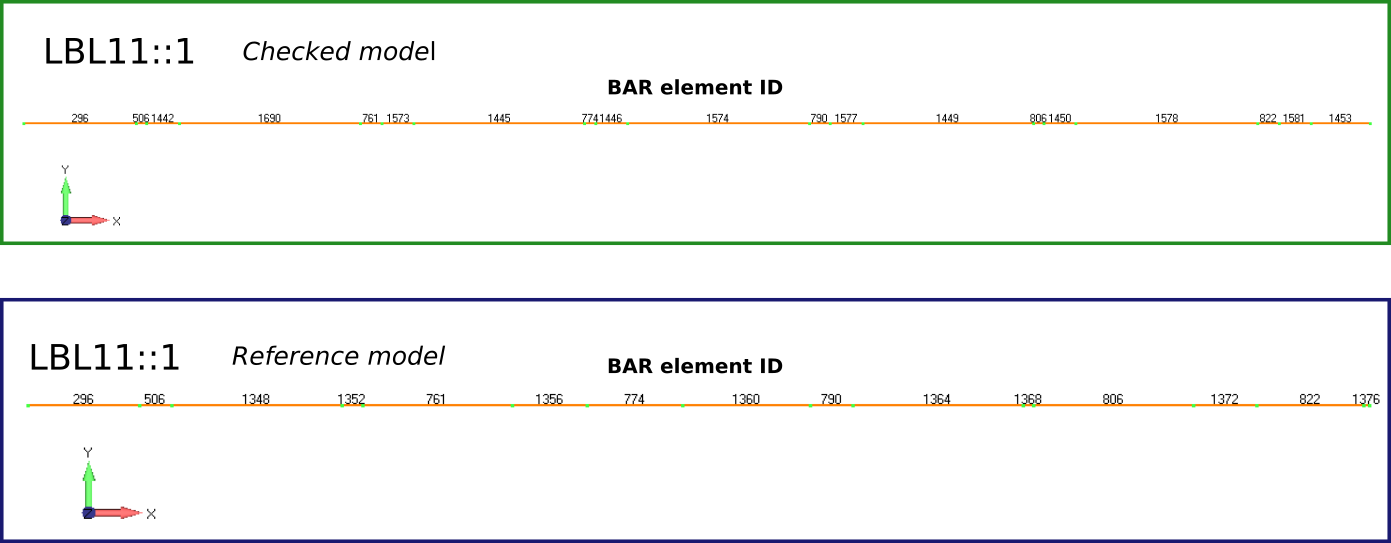
Fig. 10 View of vbeams instance LBL11::1 on checked model and reference model
In the FTools output the presentation of results on vbeams instead of BAR elements lead to a simple and more straight forward comparison.
Checkers and Analysis
This section describes the analysis performed by FTools and the basic outputs. For details outputs description, see Understanding output files further.
Non-Standard Analysis
Non-Standard Analysis deals with the analysis of items [1] loaded by a non-standard installation
A non-standard installation concerns a LOPA or portion of LOPA (aka zone) where anything but standard Seat is installed.
Since no OEM rules are provided to validate such an installation, FTools will compare the results of this loading applied on a representative Finite Elements Model against validated references.
To be as exhaustive as possible, the following items [1] are checked:
Beams/Bars (Beams Analysis)
Springs/CBUSHs (CBUSHs Analysis)
To perform those checks, FTools is triggering checkers. A non-standard checker is responsible of the comparative analysis of an item (eg. bar elements), for a given vector (eg. bending) and a given axis (eg. Y axis of the Bar elements).
The non-standard checkers are tabulated hereunder:
checker ID (CID) |
Checker Name |
vector |
FEA type |
Item |
axis |
|---|---|---|---|---|---|
1 |
nonstd_rail_shear |
shear |
CBAR |
rail |
BAR Y-axis |
2 |
nonstd_rail_bending |
bending |
CBAR |
rail |
BAR Y-axis |
3 |
nonstd_crossbeam_shear |
shear |
CBAR |
crossbeam |
BAR Y-axis |
4 |
nonstd_crossbeam_bending |
bending |
CBAR |
crossbeam |
BAR Y-axis |
5 |
nonstd_owb_shear |
shear |
CBAR |
owb |
BAR Y-axis |
6 |
nonstd_owb_bending |
bending |
CBAR |
owb |
BAR Y-axis |
7 |
nonstd_leg_fz |
force |
CBUSH |
leg |
fz |
8 |
nonstd_candel_fz |
force |
CBUSH |
candel |
fz |
9 |
nonstd_candel_my |
moment |
CBUSH |
candel |
my |
10 |
nonstd_clip_fz |
force |
CBUSH |
clip |
fz |
11 |
nonstd_clip_my |
moment |
CBUSH |
clip |
my |
12 |
nonstd_stanchion_fz |
force |
CBUSH |
stanchion |
fz |
13 |
nonstd_end_of_beam_fz |
force |
CBUSH |
end-of-beam |
fz |
14 |
nonstd_end_of_beam_mx |
moment |
CBUSH |
end-of-beam |
mx |
15 |
nonstd_fix_s44_fz |
force |
CBUSH |
fix-s44 |
fz |
16 |
nonstd_shear_panel |
shear |
shear panel |
||
17 |
nonstd_fy |
force |
Non-std Fy |
fy |
Beams Analysis
Those Analysis are performed by checkers 1 to 6 inc.
FTools is analyzing beams in a comparative way. The software will first calculate an envelope of the selected references (cf. Loading Reference) for the adequate vector (Shear or Bending) based on the mechanical characteristics of the beams. This means that for each particular mechanical property set (Inertia, Young’s Modulus, etc.), the maximal observed value is used as allowable (assuming that the references can sustain it).
For the Checked model, the same envelope is calculated by zone, providing an applied value to be compared with the relevant allowable to calculate the Margin of Safety.
This type of analysis is performed for the following 3x2=6 items and vectors:
The trace logged by the application is structured in the same way for the 6 checkers implied in beams analysis, and is a good helper in understanding the checkers actions.
Warning
The object of this section is to describe the behavior of the FTools checkers using the checkers’s trace as a support, and not to describe those traces in details. Refer to Non-Standard Outputs for this purpose.
Beams Analysis First Action: defining set of beams
The first action of Ftools is to group beams (actually NASTRAN BAR elements) by mechanical properties. This can be seen from the beam analysis trace; “beam_properties” tab. It shows how FTools is sorting vbeam, as shown Fig. 11.
Group (1) shows the vbeam details, column (2) shows the NASTRAN Property ID, whereas group (3) shows the mechanical properties. Each set of equal mechanical properties will define a group of beams with the same allowable.
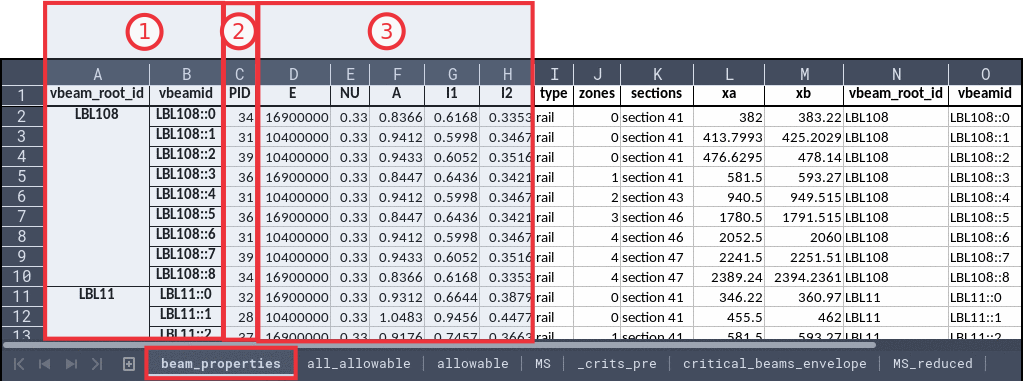
Fig. 11 Beams Analysis Trace: Tab “beam_properties”
Beams Analysis 2nd Action: defining set of beams
The second action of beams checkers will be to collect the relevant values for all the referenced models (cf. Loading Reference), as shown Fig. 12.
Group (1) shows the concerned set of beams defined by their mechanical properties. Each row has a unique set of value. Group (2) and (3) are representative of the relevant values for two reference models. For each referenced model, FTools will collect results values from a previously ran FEA and and create a new set of allowable.
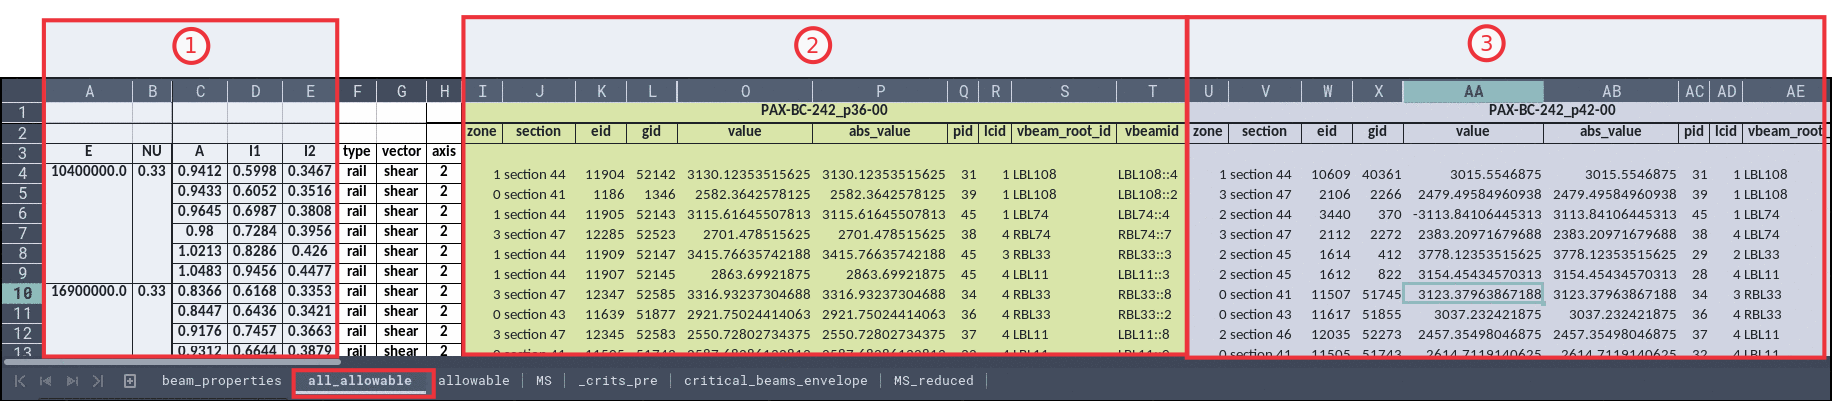
Fig. 12 Beams Analysis Trace: Tab “all_allowable”
Beams Analysis 3rd Action: reduce references values to a single allowable
The third action is to reduce the previously collected allowable to get a single value for each set of beams. In Fig. 13, one finds the same entries (1) as for Beams Analysis Trace: Tab “all_allowable”, but FTools has searched the maximum value throughout all the reference models to build up an allowable value (2).
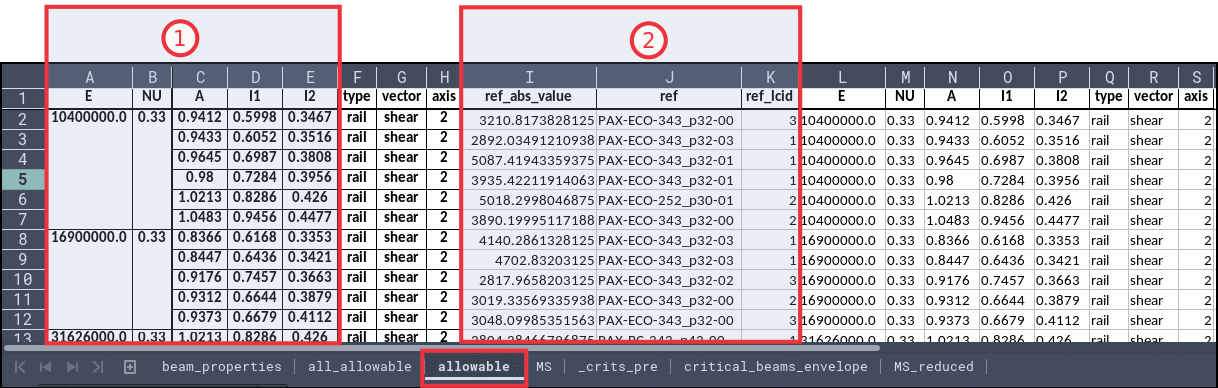
Fig. 13 Beams Analysis Trace: Tab “allowable”
Beams Analysis 4th Action: align values and calculate all MS
The fourth step is to collect relevant values (for the appropriate vector and axis) from the Checked Model and align those values in front of reduced allowable obtained from previous step. The alignment is done on beam properties.
Fig. 14 shows that FTools is calculating an MS for each section of beam and all load cases ((1)). Some FEM details are provided in (2). For eact beam’s section, the absolute value (3) is compared to provided allowable ((4)). To be transparent, the used allowable provides the referenced model used and the load case found to be responsible of the maximum value obtained from this reference model (group (4)).
It is now trivial for FTools to calculate the Margin of Safety.
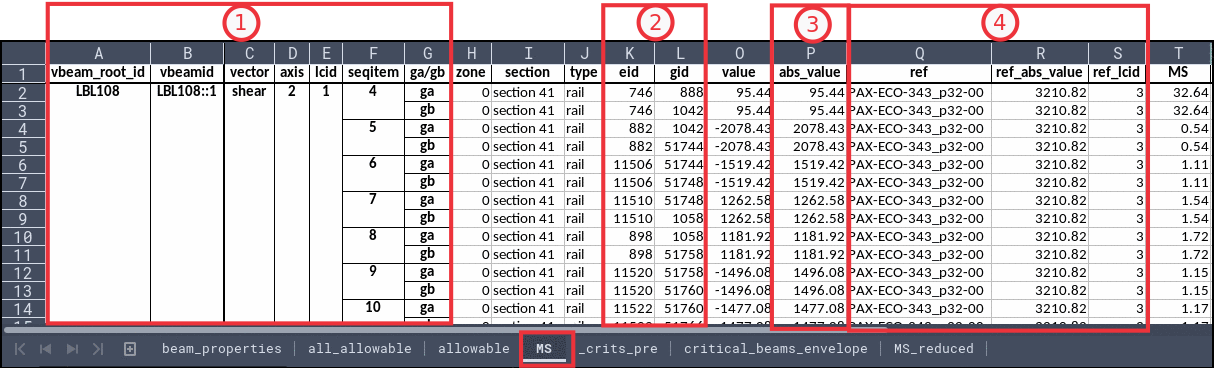
Fig. 14 Beams Analysis Trace: Tab “MS”
CBUSHs Analysis
Warning
This section is still in work
CBUSHs classifications
CBUSHs NASTRAN elements are extensively used to idealize many different supports. Depending on structural elements attached by a spring, springs are categorized as shown in Table cbushs_labels_matrix hereunder.
crossbeam |
rail |
OWB |
clamped |
|
|---|---|---|---|---|
crossbream |
Clip |
Stanchion or End Constraint |
||
rail |
Fixations |
Candel (Support Fitting) |
||
OWB |
Leg(Support fitting) |
|||
clamped |
As an example, a spring connecting a rail and a crossbeam is a Clip, and a spring connecting a crossbeam to a Single Point Constraint (aka SPC, aka clamped) is either a stanchion (if in the middle of a crossbeam) either an End Constraint.
To differentiate Support Fittings depending on if a rail or an owb is clamped, we introduced the candel and leg labels.
Those Analysis are performed by checkers 7 to 15 inc.
Sear Panel Analysis
Warning
This section is imported from a legacy work and may need a refresh
This analysis is performed by Checker ID 16.
This is a three sheets spreadsheet generated to summarize key analysis data regarding floor panels shear flow calculation:
Applied Loads: sheet used to present applied loads on seat tracks
Rolling Sums: sheet used to present cumulated Tx loads applied on seat tracks within a “sliding window”
Panel Shear: sheet used to present shear force and shear flow on each floor panel
Note
Units are not specified in this spreadsheet. Values presented are in the unit system of the analysis
“Applied Loads” sheet
The overall structure of this sheet is presented on the Fig. 15
This sheet presents the load applied on seat track for each load case.
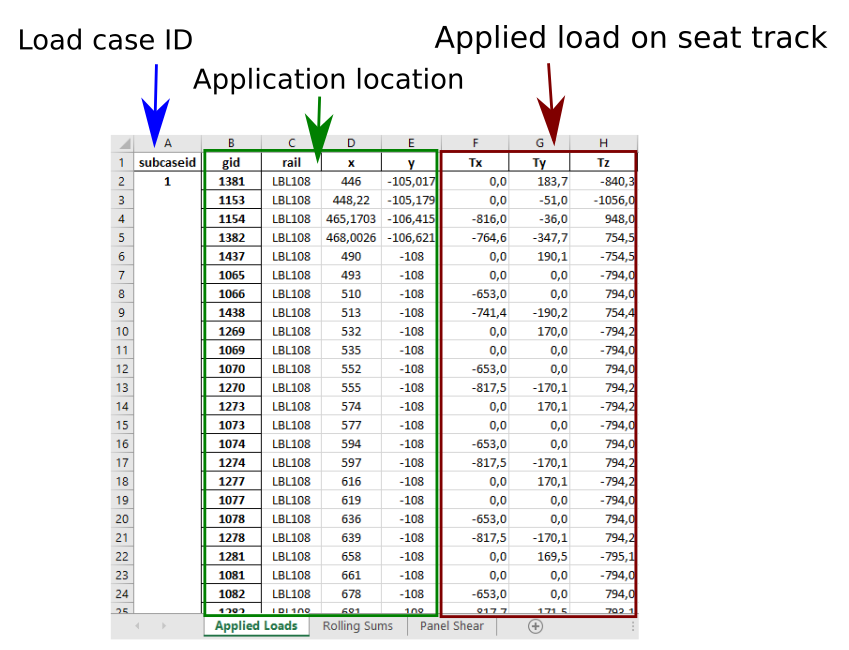
Fig. 15 “Applied loads” sheet overview
Here after is a description of the data presented in this sheet:
subcaseid: load case ID corresponding to the load case defined by the FTools user in the loading spreadsheet (see Loading Input Data)
gid: FE node ID of a seat track used to apply interface load.
rail: seat track identification on which interface load is applied
x, y: coordinate of the node in aircraft coordinate system (see AC coordinate system definition)
Tx, Ty, Tz: interface load applied on seat track
“Rolling Sums” sheet
The overall structure of this sheet is presented on the Fig. 16
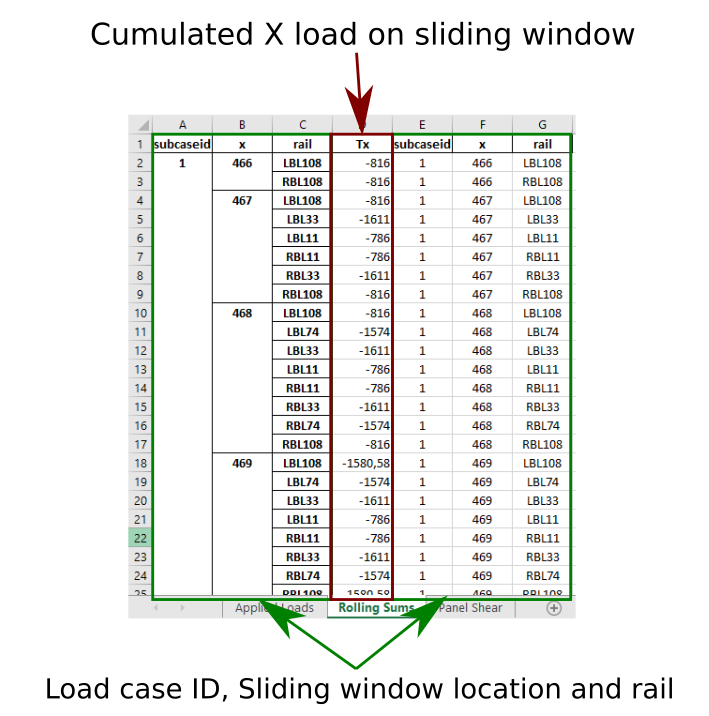
Fig. 16 “Rolling Sums” sheet overview
This sheet presents the cumulated Tx load on a sliding window of width ‘W’, located at ‘X’ (see Fig. 17)
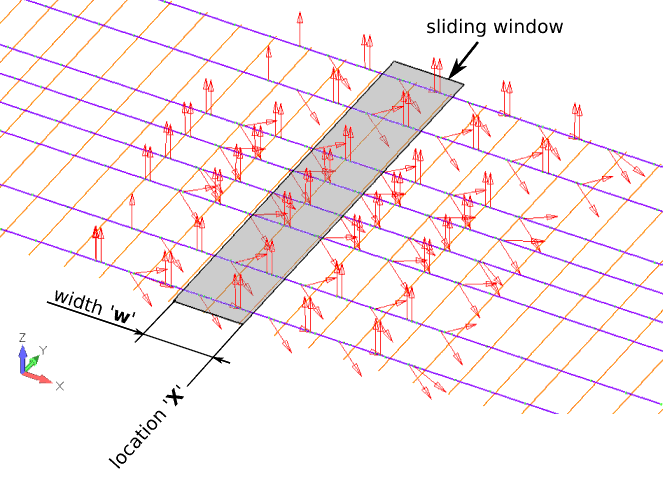
Fig. 17 Shear flow computation with sliding window
Within this sliding window of width ‘W’ (defined by FTools user at step 3 of the analysis menu with the parameter “shear running load calculation pitch”, see Step #3/3: References & Effectivity), all applied Fx load is cumulated on each seat track. This sliding window is “screening” the complete floor structure at an increment of 1 inch / 25.4mm. The location of the sliding window is specified by its coordinate ‘X’.
Here after is a description of the data presented in this sheet:
subcaseid: load case ID corresponding to the load case defined by the FTools user in the loading spreadsheet (see Loading Input Data)
xy: location of the sliding window (see Fig. 17)
rail: identification of seat track
Tx: cumulated applied Fx load on seat track
“Panel Shear” sheet
The overall structure of this sheet is presented on the Fig. 18
This sheet presents the shear force and shear flow on each panel (between two consecutives seat tracks)
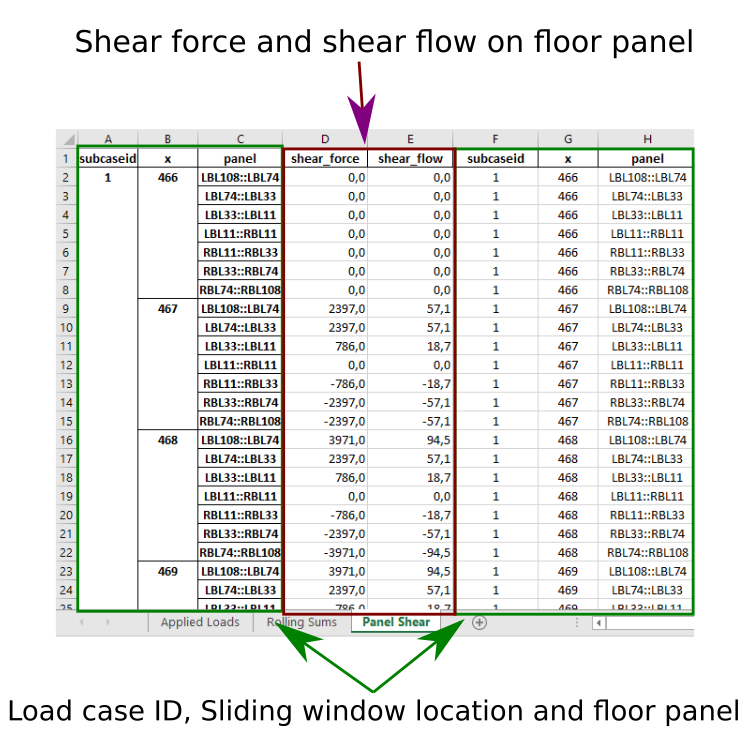
Fig. 18 “Panel Shear” sheet overview
Here after is a description of the data presented in this sheet:
subcaseid: load case ID corresponding to the load case defined by the FTools user in the loading spreadsheet (see Loading Input Data)
xy: location of the sliding window (see Fig. 17)
panel: identification of floor panel between two consecutive seat tracks
shear_force: shear force applied on floor panel computed with cumulated load Tx applied on seat tracks.
shear_flow: shear flow applied of floor panel corresponding to shear force divided by panel width ‘W’ (defined by FTools user at step 3 of the analysis menu with the parameter “shear running load calculation pitch”, see Step #3/3: References & Effectivity)
Non-Standard FY Analysis
Also known as Side-Loads analysis, this analysis is performed by Checker ID 17.
Warning
This section is still in work
Standard Analysis
The standard checkers are tabulated hereunder:
checker ID (CID) |
Checker Name |
vector |
FEA type |
Item |
axis |
|---|---|---|---|---|---|
18 |
std_fx |
force |
Std X Loads |
fx |
|
19 |
std_cum_fx |
force |
Std cumulated X Loads |
fx |
|
20 |
std_fy |
force |
Std Fy |
fy |
|
21 |
std_fz |
force |
fz |
||
22 |
std_cum_fz |
force |
fz |
||
23 |
std_item_mass |
||||
24 |
std_row_mass |
||||
25 |
std_lip_loads |
Footnotes